Tuesday, January 17, 2023

2022/23 Second Quarter NHL Betting Report

Welcome to my Second Quarterly Hockey Betting Report of the 2021/22 season. Unlike my weekly reports, the quarterly report will delve deeper into my team-by-team results and breakdown categories for the entire quarter. It should be noted that I’m not betting with real money. These are all fictional wagers in a spreadsheet. If you’re betting with real money, you should not be betting on every game, only the games you like the most. Whereas I’m betting on every game, every over/under, because it provides a complete dataset for macroeconomic analysis. Most of my lines were recorded from Draft Kings near noon Pacific time the day before games, and unlike last season, I’m recording alt pucklines for underdogs -1.5 goals and favorites +1.5. To view my 1st Quarter Report, click here.
 
To read my first quarterly report, click here. If you would like to read a comprehensive analysis of the last three years of hockey betting, my new book “The Hockey Economist’s Betting Prospectus” is available in the Amazon store. Just imagine this quarterly report but nearly 400 pages. You’ll get a profitability breakdown of the major categories since October 2019, and a chapter detailing the results for each team. Half of it discusses my own results, while the other half discusses what I should have been betting. To read more, visit the Amazon store.
 
My 2nd Quarter Profit: $5,527
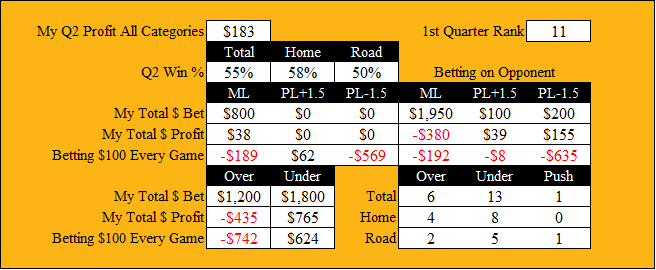
My 1st Quarter Profit: $5,786

The second quarter (henceforth referred to as Q2) spanned from Nov 23 to Jan 9 (or week 7 to week 13), starting right before American Thanksgiving break, and at that time I was giving thanks for the outstanding play of the New Jersey Devils, who had climbed into the number one spot in my Power Rankings. Who would have predicted that Devils-Isles would be ranked #1 and #2 in the Metro at Thanksgiving after both missed the playoffs in 2022? Certainly not me. At the end of week 7, they had an astonishing combined record of 33 wins, 12 losses. That actually would have been a good time for me to take all my chips and cash out of the casino.

Much to my dismay, both teams would regress in Q2 going a combined 19-23. The Devils particularly had a run going 21-3 that was insanely profitable for any bettors aboard their bandwagon, but then ran into a brick wall going 0-4 in week 10. They peeled off a stretch with 2 wins in 11 games, which hit me especially hard, at least for that cataclysmic first week. Fortunately for me, just as one opportunity was closing, another was opening. The tank finally took hold of the Chicago Blackhawks, I pushed all my chips into the middle of the table, and hit a December jackpot.

The Devils relinquished the top spot in my Power Rankings during that disastrous week 10, usurped by the Buffalo Sabres, who held on right until that halfway mark. Buffalo was the best team in the entire league to bet on the moneyline (Washington and Winnipeg sitting at #2 and #3) as they won a majority of their games while regularly getting priced as underdogs. The Sabres might have been atop my Power Rankings, but part of that was due to strong Q1. It should be noted, Buffalo surrendered that top spot in the first week of Q3 and had lost 4 of their last 5 games at the time this report was published. Stay tuned.

Having said all that, neither Chicago or Buffalo were my top revenue generating team in Q2, as that honor goes to the Toronto Maple Leafs, who climbed from #28 to #3 in my Power Rankings. The mighty Leafs went 15-6 and solicited my attention when they snapped the Devils 13-game winning streak on the first day of Q2. That was the moment my ticket on their bandwagon was purchased, and they would win 9 of their next 10 games. I might be a Leafs hater, but I’m more than happy to board their wagon when the going is good, which it was for the entire second quarter (though line prices have started getting alarmingly expensive).

At the other end of the spectrum, the team that cost me the most money was the Philadelphia Flyers, with most of that coming in the last 2 weeks of the quarter thanks to my futile attempt at profiting from a Carter Hart injury (dropping Philly from #8 to #28 in my ranks). My second worst team was the Nashville Predators, who sank to the bottom of my Power Rankings (with a little help from Q1). It was interesting that several of my best Q1 teams where among my worst in the 2nd quarter, while many of my worst teams then became my best. A big reason for that was properly exploiting Tankfest ’23.
 
My profit betting Chicago to lose was an impressive $3,119, followed by Anaheim and Colorado. The Avs were the #1 team to bet against adding together moneylines and pucklines, and also showed up on my list as well. I was certainly targeting their opponents when Nathan MacKinnon was out of the line-up. The teams that I should have been betting against more aggressively were Vegas and Florida. The Panthers were +600 to miss the playoffs in September but -170 by January 16. Though they were on a 5-2 run at the time this report was published (they’re now 4 PTS out of the last wildcard).

You can read more about each squad in the team sections below, where you’ll get quarterly betting stats and a 300+ word summary for all 32 teams. I made a nice $5,527 profit in the second quarter, and that’s despite a loss of -$1,262 from over/unders. The All-star break is just a few weeks away, and it was that break last season when my latest over/under algorithm was tested and put into use, which made a giant profit in the post All-star scoring boom. I’ll take the downtime to test some improvements that will hopefully help me crush the second half. Those results will be discussed in my weekly reports, and eventually in my Q3 report.


Over/Under


My 5 Best Over/Under Bets:                                Market’s 5 Best Over/Under Bets:

                                                                                    ($100 wagers)


1) St. Louis overs, (+$1,104)                                1) St. Louis overs, (+$899)

2) Ottawa unders, (+$767)                                   2) San Jose overs, (+$881)

3) Pittsburgh unders, (+$765)                             3) Columbus unders, (+$776)

4) San Jose overs, (+$761)                                    4) Ottawa unders, (+$691)

5) Columbus unders, (+$761)                              5) Pittsburgh unders, (+$624)


My 5 Worst Over/Under Bets:


1) Washington overs, (-$1,117)

2) Seattle overs, (-$988)

3) Montreal overs, (-$852)

4) Detroit overs, (-$826)

5) Colorado overs, (-$805) 


My over/under algorithm was riding high entering Q2, performing remarkably well in weeks 6 and 7, pulling impressive profit from both overs and unders. But that also marked the peak, as the rest of the quarter was struggling to break even. One observation that was repeated in my betting reports was that it seemed like oddsmakers were smarter about setting the lines. Those sensational weeks 6 & 7 occurred when the totals were set at an equilibrium where you would have lost money betting every over or every under.

You may recall that last December for the booming overs, back when the NHL still had strict testing protocols and the Omicron variant was spreading rapidly through the NHL, forcing multiple teams to quarantine for a big chunk of December. Last year goal scoring increased from 5.9 per game in the first quarter, jumping to 6.3 in Q2. Meanwhile the average betting total only increased from 5.7 to 5.8 as books did properly adjust. This year, there was a slight decline in scoring from Q1 to Q2 from 6.4 to 6.3, while the avg total dropped from 6.4 to 6.2 which led to a significant increase in the profitability of unders.
 
The bigger issue is that the percentage of games under 6.5 goals increased from 51% to 55%. There were a scattering of really high scoring games that masked a bigger shift to unders, and that’s why my algorithm struggled. Like the Kraken following up a 17-goal game with 4 consecutive unders of 6 goals or less. It was week 8 when I officially labelled the under movement “undermageddon” when unders went 31-21-2 and when there’s a trend shift, it can take a few games before I start getting good advice. But that one 5.8 goal week was preceded by a 6.5 avg goals week, and followed by a 6.4 avg goals week, so that one freak week appears to have been random variance.


When my algorithm struggles, it is often attributable to 2-3 teams throwing curveballs. Every week that I report a bad performance, there are always a small number of teams that are personally to blame. I’m reporting a -$1,262 loss in the second quarter, but would be celebrating a respectable $1,171 profit if you simply deleted Washington, Seattle, and Detroit from the sample (generating a 3.3% return on games not involving one of those 3 teams) (it also would have returned a profit if not for losing -$1,708 betting over/under in the last 4 days of Q2). It went 6-16 picking Caps over/under. Their unders went 13-9-1, and yet somehow I lost -$357 betting that outcome too.

The biggest problem with my algorithm was the games where it recommended betting double on overs, losing -$2,277 versus a $1,773 profit betting double on unders. It recommends betting double when the average goals per game of the two teams involved is greater or less than 0.75. An uncomfortable number of those losses on overs, which are supposed to be the games it likes the most, where led astray by freak high scoring games. I’ll have to do an investigation at some point (either All-star break or summer) if there was an increase in outlier games, and the best way to mitigate their impact.

This last month of malaise has me paying a little closer attention to the algorithm’s recommendations. Instead of just accepting them all blindly, I’m looking at the game logs to see if there are any outliers having an exaggerated impact. During the All-star break I’m going to test some modifications to discount the impact of outlier games, but in the meantime will be executing more manual overrides. All my decisions for each game are made in a “game summary” worksheet, that imports season stats and game logs for both teams involved, informing my choices.

One of the big over/under stories of Q2 was the Columbus Blue Jackets flipping from one of the best over teams to one of the best under wagers. BJ overs were among my cash cows last season, so it was demoralizing to lose that revenue source. They finished Q1 on a streak of 6 consecutive overs, then immediately began a new streak of 6 consecutive unders at the beginning of Q2. I took a -$600 loss early in that trend shift, but eventually my algorithm got on the right side and Columbus unders finished the quarter as one of my best O/U wagers of the quarter. (spoiler alert: one week into Q2 their overs are on a 5-2 run)


Goalies
 
Market’s 5 Best Goalies to Bet on:                     Market’s 5 Best Goalies to Bet Against:
($100 ML + $100 PL+1.5 + $100 PL-1.5)            ($100 ML + $100 PL+1.5 + $100 PL-1.5)
 
1) Martin Jones, (+$2,539)                                   1) Alexandar Georgiev, (+$2,217)
2) Samuel Ersson, (+$1,716)                                2) Jacob Markstrom, (+$1,434)
3) Ukko-Pekka Luukkonen, (+$1,678)               3) Sergei Bobrovsky, (+$1,261)
4) Connor Hellebuyck, (+$1,584)                        4) Ilya Sorokin, (+$1,225)
5) Pheonix Copley, (+$1,513)                              5) Jake Allen, (+$1,141)
 
My 5 Best Goalies to Bet on:                                My 5 Worst Goalies to Bet on:
(ML + PL)                                                               (ML + PL)
 
1) Linus Ullmark, (+$1,651)                                 1) Ilya Sorokin, (-$901)
2) Ukko-Pekka Luukkonen, (+$1,489)                2) Pyotr Kochetkov, (-$900)
3) Jaroslav Halak, (+$1,348)                                3) Jeremy Swayman, (-$840)
4) Ilya Samsonov, (+$1,194)                                 4) Jonathan Quick, (-$747)
5) Martin Jones, (+$958)                                      5) Igor Shesterkin, (-$625)
 
My 5 Best Goalies to Bet Against:                      My 5 Worst Goalies to Bet Against:
(ML + PL)                                                              (ML + PL)
 
1) Arvid Soderblom, (+$1,672)                            1) Samuel Ersson, (-$1,431)
2) Petr Mrazek, (+$1,499)                                    2) Juuse Saros, (-$902)
3) Alexandar Georgiev, (+$1,401)                       3) Igor Shesterkin, (-$849)
4) Magnus Hellberg, (+$1,260)                            4) Tristan Jarry, (-$749)
5) James Reimer, (+$785)                                    5) Thomas Greiss, (-$717)
 
The list of best goalies to bet has some names you might not expect, especially #1 on the list Martin Jones. The Seattle goalie was sensational in the first quarter, but saw his SV% drop from .913 to .875 in Q2, yet won 10 of his 12 starts. He had 6 wins in games where he allowed 4 or more goals, as the Kraken provided plenty of goal support. When he got burned for 8 tucks, no problem, Kraken scored 9. Also 8 of his 10 wins were by at least 2 goals, so if you bet $100 on Jones -1.5 goals in every Q2 start, then you banked $1,480 (as opposed to $738 on the moneyline).
 
Many of you probably don’t even know who Samuel Ersson is, but he replaced an injured Carter Hart and won 4 of his first 5 games after doing so, 3 of those by at least 2 goals (with pucklines hitting at +450, +220, and +400). If you were fortunate enough to jump on the Flyers bandwagon after Hart was injured, you could have hit the jackpot. Sadly for me (and probably many others), the injury was perceived as a lucrative opportunity to go big on Philly opponents. That’s how I lost -$1,431 betting Ersson to lose, as no goalie cost me more money in Q2, and I had no idea who he even was 2 months ago.
 
Connor Hellebuyck is the only elite goalie on the profitability leaderboard (Linus Ullmark very nearly qualified for the top 5), as there are bigger names on the best goalies to bet against list. What helped Hellebuyck was that the Jets scoring increased from 2.9 per game in Q1 up to 3.6 in Q2, while his own goals against average increased from 2.07 up to 2.48. Ukko-Pekka Luukkonen was one of my best goalies to bet, but he was sent back to the minors to start the third quarter because he’s waiver exempt and Eric Comrie returned from injury (though he was back in the NHL no long thereafter).
 
One thing that really surprised me from my own best/worst goalies to bet on lists, was that Igor Shesterkin was one of my worst goalies when betting to win, while his back-up Jaroslav Halak was among my best. I spent most of the first quarter actively avoiding betting Rangers if it seemed likely Halak would start, but once they got hot in the 2nd quarter, I stopped exercising that discretion. Halak generated a lowly .883 SV% in the first quarter, but an above average .907 in Q2. Not only did Halak get better, his teammates in front of him started scoring more goals, making him a decent betting option.
 
The best goalie to bet against was actually Alexandar Georgiev, who had a drop in SV% from .929 to .905 from one quarter to the next as Colorado was decimated by injuries (he cracked my leaderboard as well). Some of that can likely be attributed to Georgiev himself, but the Avs also started dramatically over-using their top 2 forward lines, which surely caused the defensive play to suffer. Ilya Sorokin was also a bad goalie to bet in Q2. His SV% only dropped from .926 to .923, but only won 6 of 15 starts because the team was scoring fewer goals, and play in a very difficult division. He also missed time due to injury.
 
Jacob Markstrom was the #2 worst goalie to invest in, as he temporarily ceded the primary starter duties to Dan Vladar when he struggled early in the quarter. There was a limited window when it was very profitable to short Markstrom, as he settled down later in December. My two best goalies to bet against were on the Chicago Blackhawks, Petr Mrazek and Arvid Soderblom (.870 and .878 save percentages respectively). I had incredible success exploiting the tank after a rough first quarter. Alex Stalock returned from injury to post a .923 SV% in 6 starts, so I was a net loser when betting against one Chicago goalie. Let’s hope he gets traded.
 
 
Back-to-Backs
 
The profitability of betting rested teams against tired opponents plunged from the second half of 2021/22 to the first quarter of 2022/23 (after a fast start in the first couple weeks). It wasn’t a function of rest advantage diminishing in effectiveness, but rather oddsmakers just jacked up the prices. There were some bad weeks in November, but in December betting rested teams against tired opponents started surging back into relevance (after being my worst category in the first quarter). The prices were still expensive, but it was worth the cost.
 
By week 10 (which was 3 weeks into Q2), it had become clear that this category was re-asserting itself as one of my best. At that point, there had been 42 rest disadvantages in Q2, with the rested winning 59.5%. Despite promising myself to lay off these after a bad first quarter, my foot never really eased of the gas pedal, betting them 40 of 42, winning $2,426. Btb moneylines produced $1,072 Q2 profit, while pucklines -1.5 goals (both favorites and underdogs) won an astounding $2,724. By the end of Q2, they were 46-28 (62%) on the moneyline, and covered -1.5 goals in 36 of those (48%).

Some weeks I would combine moneyline and puckline in my best category rankings and just call it “shorting back-to-backs” but the differing performance of the two eventually required a split. It also needs to be noted that if you are going to deploy a shorting btb strategy, you should be placing your wagers as close to the opening line as possible. Whatever tax oddsmakers charge for btbs, the public is willing to pay it, driving the prices even higher by puck drop. The payout was bet down from open to close in 60% of these opportunities, 64% when the home team has the advantage.

A large majority of rest disadvantages are road teams, as those on road trips are more likely to get booked on consecutive nights. You might think that it’s better to bet a home team against a tired opponent, but the rate of return was substantially higher when the home team is the tired one. If you bet $100 on every road rest advantage, you banked $878 (winning 70%). But betting every home rest advantage (of which there were more than twice as many) only banked $194 (winning 59%). This was also observed in past seasons (which you can read about in my book) and is not a new phenomenon. My theory is a tax on home teams, and that road advantages attract less public money.
 
Note the leaderboard below is for the entire 1st half, not just the second quarter. Every other leaderboard in this report is exclusively Q2, but sample sizes for this group are too small, and I did not not include such a leaderboard in my Q1 report.

  
Best Bets With Rest Advantage:                         Best Tired Teams to Bet Against:
($100 moneyline)                                                   ($100 moneyline)
 
1) Anaheim Ducks (+$350)                                  1) Pittsburgh Penguins, (+$620)
2) Minnesota Wild, (+$320)                                 2) New York Rangers, (+$334)
3) Winnipeg Jets, (+$246)                                    3) Los Angeles Kings, (+$304)
 
Best Bets With Rest Advantage -1.5 Goals:     Best Tired Teams to Bet Against -1.5 Goals:
($100 puckline)                                                     ($100 puckline)
 
1) Chicago Blackhawks, (+$785)                        1) San Jose Sharks, (+$734)
2) Minnesota Wild, (+$784)                                2) Dallas Stars, (+$715)
3) Buffalo Sabres, (+$720)                                  3) New York Rangers, (+$670)
 
The Anaheim Ducks generated the most profit on the moneyline, but they also had more rest advantages than any other team with 9 in the first half, and the Ducks only went 5-4 in those games, but those 5 wins were all as underdogs. Meanwhile Seattle had 8 advantages and Buffalo had 7, rounding out the top 3 most frequent advantage recipients. By comparison Montreal and LA only had one each. Chicago had 6 opportunities and won 3 of them, but also covered -1.5 goals in those 3 games at +350, +550, and +185.
 
Meanwhile, St. Louis and Tampa were the two teams that faced a disadvantage more than anyone, and the Blues were among the worst teams to bet against when tired. The very worst was Carolina, who went 4-0 when tired versus rested opponents. Boston being the 2nd worst, the Blues 3rd.  Seattle and Washington only faced 1 rest disadvantage each, so the Kraken had an 8:1 ratio, which surely helped boost their strong first half. Two of the weaker teams who were bad to bet against when tired were Detroit and Vancouver, as you would have posted a net loss betting $100 on them to lose each.
 
 
My 1st Quarter Results:
 
*Market Bets calculated by betting exactly $100 on every outcome this quarter*
 

For the second consecutive quarter, road moneyline was among my very best categories, except this time, it was driven entirely by favorites. Last quarter, a majority of my profit was produced by road dogs, which lost money for me in Q2 as a group. Home teams won 55% of games in the first half last season, but eventually settled at 53% by the end. In the first half of 2022/23, they won 52.3%. While they won fewer first half games this season, the average line price was more expensive (up from 55.8% implied probability to 56.3%), which is roughly -125 to -130. I technically laid more money on home moneyline, but generated a much higher return from visitors.
 
Winning percentage dropped while prices got more expensive. Visitors improved while hosts paid a bigger tax. The 5 most profitable road teams on the moneyline were Buffalo, St. Louis, Vancouver, Seattle, and Washington. Whereas the worst teams to bet on the home moneyline were New Jersey (by a wide margin), Chicago, San Jose, St. Louis, and Colorado (odd considering where they play). The Devils struggling at home is not a new concept, as the previous 3 seasons combined, they won 37% of their road games and 35% at home. Washington being a strong road team is also consistent with what we’ve observed in recent history.
 
Of course, what’s most interesting is the team that showed up on both lists, the St. Louis Blues. One of my rules that I’ve repeated several times in my betting reports and book, is never trust the St. Louis Blues to win or lose. They are prone to blowing easy games against worse teams, but can beat any opponent on any night. If you bet $100 on the road team in every Q2 Blues game, you banked $840. The Sabres were easily my best road team, as they did win a majority of their home games, but won a very impressive 78% from the visitors dressing room.


You would have only won $51 betting $100 on every single road team in Q2, but only because of a catastrophic week 11 when they lost -$1,338 on $100 wagers, as home teams won 65% of games that week. If you delete week 11, road teams won more than they lost. That awful week by road teams was 95% road teams, as you would have very nearly turned a profit betting road favorites that week. At no point this season did I say to myself “start betting road teams more often”, it all just materialized in the sum of all my individual bet choices. I’m a bargain shopper, and tend to shy away when there’s an obvious tax on a line.
 
Road teams were only favored in 33% of Q2 games while home favorites had a bad quarter (betting $100 on each moneyline would have produced a -$1,357 loss). Home favorites -1.5 goals actually produced a greater loss if you bet those instead (-$1,843), whereas the rate of return on road favorites -1.5 goals nearly doubled road fave moneyline. This was a fantastic quarter for me betting favorites -1.5 goals (both at home and on the road), but the secret to my success was in the teams I was targeting to lose by 2+ goals, Chicago, Anaheim, and Detroit. Though I should also have targeted Florida and Colorado more often.


At the end of November I was promoting underdogs -1.5 goals as a sensational bet, because it had produced incredible returns for a few weeks. But they were already in decline at the end of Q1, and completely nosedove Q2. Betting $100 on each would have cost you
-$4,605. I had already stopped betting those by the start of Q2, but stayed on the Coyotes (a little too long after) that bet stopped cashing. Yotes -1.5 goals has produced a loss in 7 of the last 8 weeks, so I hope everyone stopped hitting that. It was a great bet in Q1, but a net loser in Q2.
 
This is my first season tracking alt pucklines, -1.5 for dogs and +1.5 for favorites, but aside from a few good weeks, neither has been a worthwhile bet at large. It’s more useful to examine at the team level, to see which teams are consistently good at one or the other whether they’re favored or underdog. It was just a terrible quarter for underdogs, as they were net losers in every permutation, home/road/moneyline/puckline. January last year was when favorites caught fire, but dog did finish ahead in week 1 of the third quarter.
 

My Best Categories:                                           Market’s Best Categories:
(all wagers)                                                          ($100 wagers)
 
1) Road favorites moneyline, (+$3,939)          1) Shorting back-to-back -1.5 goals, (+$2,724)
2) Favorites -1.5 goals, (+$3,206)                     2) Road favorites -1.5 goals, (+$2,276)
3) Shorting back-to-back ML, (+$2,457)        3) Road favorites moneyline, (+$1,100)
 
My Worst Categories:                                         Market’s Worst Categories:
(all wagers)                                                           ($100 wagers)
 
1) Overs, (-$2,806)                                              1) Underdogs -1.5 goals, (-$4,605)
2) Home favorites moneyline, (-$1,342)            2) Overs, (-$3,611)
3) Road underdogs moneyline, (-$570)             3) Home moneyline, (-$3,216)
 
Market Best Moneyline Bets:                             Market Best Teams to Bet Against ML:
($100 wagers)                                                        ($100 wagers)
 
1) Buffalo Sabres, (+$698)                                   1) Calgary Flames, (+$808)
2) Washington Capitals, (+$566)                        2) New Jersey Devils, (+$623)
3) Winnipeg Jets, (+$493)                                    3) Colorado Avalanche, (+$582)
 
Market Best Bets +1.5 Goals:                         Market Best Teams to Bet Against +1.5 Goals:
($100 wagers)                                                        ($100 wagers)
 
1) Philadelphia Flyers, (+$484)                          1) Colorado Avalanche, (+$644)
2) Washington Capitals, (+$457)                        2) Calgary Flames, (+$397)
3) Boston Bruins, (+$311)                                   3) Vegas Golden Knights, (+$372)
 
Market Best Bets -1.5 Goals:                          Market Best Teams to Bet Against -1.5 Goals:
($100 wagers)                                                        ($100 wagers)
 
1) Washington Capitals, (+$1,066)                     1) Florida Panthers, (+$1,205)
2) Seattle Kraken, (+$1,060)                               2) Chicago Blackhawks, (+$1,172)
3) New York Rangers, (+$855)                            3) Colorado Avalanche, (+$1,105)
My 5 Best Teams to Bet on:                                 Market’s 5 Best Teams to Bet on:
(ML + PL)                                                              ($100 ML + $100 PL+1.5 + $100 PL-1.5)
 
1) Toronto Maple Leafs, (+$2,360)                     1) Washington Capitals, (+$2,088)
2) Minnesota Wild, (+$1,161)                             2) Seattle Kraken, (+$1,669)
3) Washington Capitals, (+$1,037)                     3) Winnipeg Jets, (+$1,523)
4) Buffalo Sabres, (+$1,022)                               4) Buffalo Sabres, (+$1,300)
5) Tampa Bay Lightning, (+$829)                      5) New York Rangers, (+$1,221)
 
My 5 Worst Teams to Bet on:
(ML + PL)
 
1) New Jersey Devils, (-$1,270)
2) Carolina Hurricanes, (-$862)
3) Calgary Flames, (-$516)
4) St. Louis Blues, (-$375)
5) Montreal Canadiens, (-$250)
 
My 5 Best Teams to Bet Against:                       Market’s 5 Best Teams to Bet Against:
(ML + PL)                                                             ($100 ML + $100 PL+1.5 + $100 PL-1.5)
 
1) Chicago Blackhawks, (+$3,119)                     1) Colorado Avalanche, (+$2,331)
2) Anaheim Ducks, (+$1,969)                             2) Chicago Blackhawks, (+$1,658)
3) Colorado Avalanche, (+$1,792)                      3) Florida Panthers, (+$1,310)
4) Detroit Red Wings, (+$1,579)                        4) Vegas Golden Knights, (+$1,061)
5) San Jose Sharks, (+$1,199)                            5) Montreal Canadiens, (+$970)
 
My 5 Worst Teams To Bet Against:
(ML + PL)
 
1) Philadelphia Flyers, (-$1,687)
2) Nashville Predators, (-$1,251)
3) Vancouver Canucks, (-$653)
4) Ottawa Senators, (-$576)
5) New York Rangers, (-$489)
 
 
Team By Team Power Rankings
 
The team-by-team gambling Power Rankings are ordered by the sum of all my bets on each team to win or lose, over or under for the entire season. They are my own personal power rankings, reflecting my own success picking the outcome of their games. These aren’t necessarily the best teams to bet on, as some were swung by a few instances of good luck or bad judgement. You’ll have to read the team summaries for a deeper understanding of the replicability. If you are going to be betting on hockey in the near future, it may help you to read about my own personal success and failure each quarter. I’ll also list the results of betting $100 on every outcome for each team.
 
 
1) Buffalo Sabres, ($2,423):
 

There were several teams who ranked above Buffalo in my Q1 Power Rankings that proved unsustainable and plunged down the ranks. But my success betting Sabres games proved to be maintainable, once again pulling a strong profit both when betting them to win and lose. The playbook is simple, love them as underdogs and get uncomfortable when they’re favored (especially when they’re heavy faves). Team goal scoring got a big boost in Q2, as they were the highest scoring team of the quarter, helping them win 63% of their matches.

 
The Sabres were underdogs in 68% of their games, which is why my money was on Buffalo in 75% of their matches. Granted, there were two very large bets on New Jersey and Colorado (pre-MacKinnon injury) which is how I was able to generate a good return betting them to lose when that was a terrible wager overall. My rate of return on Sabres wins was incredible, which makes sense when a frequent underdog wins a majority of their games. Despite my strong performance, it could have been better. Nearly all my investment was on the moneyline, but they had a higher rate of return -1.5 goals.
 
Their overs went 11-6-2 but my algorithm recommended an 80% stake, which was a little too much. They rarely went 5 games without a really high scoring game, as their output increased to 4.2 goals per game, but that was also offset by improved defensive play. Ukko-Pekka Luukkonen started 12 of 19 games with an .897 SV% and 3.45 GAA, yet produced a 9-3 record. He was one of the best goalies in the league in which to invest your wagers. Craig Anderson had a .928 SV% but a 3-4 record, and I was a net loser in his starts. Anderson unders went 4-2-1, while UPL overs went 9-2-1.
 
 
2) San Jose Sharks, ($2,233):
 

The Sharks were a bad team in the first quarter, but managed to win a shocking 56% of their road games (with just 17% on home ice). That was partially to blame for my Q1 loss betting them to lose, the other being that they were good at covering +1.5 goals, with me losing some big bets on their opponents -1.5 goals. So I reduced my investment in their opponent pucklines, but then they ceased being good at covering +1.5, explainable by an injury to their best goalie James Reimer, who was helping the team stay in games despite a stunning lack of depth on the blueline.
 
The Reimer injury proved to be a big boost for their overs, which drove my Sharks Q2 success. They were already a good over team before the injury, but their efficiency improved considerably. Kaapo Kahkonen started 9 games with am abysmal .846 SV%. Even when Reimer did return, their overs never stopped cashing because he wasn’t playing as well. He had a .906 Q1 SV%, but that dropped down to .879 in his first 6 games back. That was fortunate for me because my algorithm recommended an 88% stake in Shark Q2 overs. Their goals per game (for and against) went from 6.4 in Q1, all the way up to 7.3 in Q2.
 
My algorithms to approximate line value tended to recommend betting San Jose on the road, but less so at home. Even when the advice was to bet San Jose, it was often ignored. Those algorithms are employed to make recommendations, but all my bets are judgement calls.  Their overs went 15-5, but Reimer went 5-3 (after going 7-7 in Q1) while Kahkonen went 8-1 (Dell and Makiniemi went 2-1). I generated $1,016 of profit in Reimer starts, but only $104 from Kahkonen (losing nearly -$500 betting him to win, almost entirely against bad teams that technically San Jose should have beaten).
 
 
3) Toronto Maple Leafs, ($2,129):
 

My bad first quarter betting Leaf games mostly came from laying too much money on Toronto to win in some of their upset losses. This might have compelled me to pump the brakes on picking them to win, but they started Q2 on a hot streak and I enthusiastically hoped aboard their bandwagon. Their victory against New Jersey on November 23 was the spark that lit my fire, helping them climb from #28 in my Q1 Power Rankings all the way up to #3 by the end of the second quarter. After that win against the Devils, I bet Toronto to win for the next 10 consecutive games, banking $1,630 in that span.
 
The one thing that can push me to bet their opponents is when the “Leaf tax” gets too high, but there was very little complaining about line value in my Q2 Leafs game notes, though the discourse did increase post-Christmas, when there were more conspicuously high lines. One thing that might have suppressed their line prices were the injuries to their blueline, especially their #1 quarterback Morgan Reilly, but he returned Dec 29. There was every reason to think this team might struggle in his absence, but anyone who disregarded that logical intuition was rewarded for their faith. Like me.
 
They were an especially dominant team on home ice, and were tied with Boston and Carolina for the highest win% (all venues) of any team in the second quarter. Toronto was helped by receiving strong goaltending, led by Matt Murray and his .916 SV%. That was a big gamble by Dubas in the offseason that has paid off. I actually generated a higher rate of return from Ilya Samsonov (.912 SV%). For a team that won 71% of their games, I performed remarkably well when betting them to lose, regardless of which goalie started. I only bet Leaf opponents when there was very generous line offerings.
 
 
4) Anaheim Mighty Ducks, ($1,892):


My first quarter Ducks performance was embarrassing. They lost 74% of their games, and I actually lost money betting them to lose (insert ugly ducking joke). Thank heavens I pressed down harder on the gas pedal, getting even more aggressive betting Anaheim opponents with fantastic results. They were actually a slightly better team in Q2, and much better at home than the road in both quarters. The key to my successful aggression was Duck hunting on the road, picking them to win more at home (generally as longshots), giving me a solid rate of return at both venues.
 
What’s blowing my mind is that I bet Anaheim to win/cover 9 times in their last 11 Q2 GP and actually generated a 33% rate of return when doing so, yet they only won 32% of their games. My betting them that often later in December was not a conscious strategy on my part, but the lines on their opponents grew a little too expensive and John Gibson started playing better, both of which I was recording in my game notes (he went from an .891 SV% up to .907). Gibson can be a problem when he’s on. Johnny missed a week in the middle of the month with injury, but Lukas Dostal was above average when given the #1 role.
 
The Ducks ranked #28 in my week 7 Power Rankings, and 28 days later they were all the way up at #4. My primary source of revenue was -1.5 goals on the puckline. They might have lost 68% of their games, but if you bet $100 on the moneyline on every Anaheim opponent, you only walked away with $69. You were better off betting the puckline. Both their overs and unders lost money, going 11-11, but you could have turned a small profit by betting John Gibson overs and Lukas Dostal unders. I made a small profit on Anaheim unders.
 
 
5) Minnesota Wild, ($1,890):
 

Most of my profit betting Wild games in the first quarter came in week 2 when they were off to a terrible start and Marc-Andre Fleury couldn’t stop a beach ball. Their overs popped early in the schedule, but their unders caught fire in the back half of Q1. Wild unders were on an impressive 11-2 run until their overs suddenly went on an 8-0 run as goal scoring increased. That was followed by their unders going on another 7-2 run as Filip Gustavsson dramatically improved his play in goal, earning a nearly equal time share with Fleury. Gustavsson overs went 3-4-2 while Fleury overs went 8-4.
 
All this abrupt trend shifting confounded my algorithm for a few weeks before getting on the right side, but eventually posted a $9 Q2 profit. It could have been much worse. The Wild were themselves a much better team, and it was a substantial increase in goal scoring that helped their overs and their win totals (climbing from 2.7 goals per game to 3.7 while goal prevention was slightly better), as their overs finished with an 11-8-2 record. They have been an incredible team on home ice in recent years, but crashed in the first quarter, winning only 33% (compared to 56% on the road).
 
That’s why I struggled betting them to win early in the schedule, but it flipped in Q2 when they returned to dominance in front of their own fans, winning 75%. Two weeks into Q2, my line value algorithms started encouraging me to bet Minnesota. One week later I wrote in my game notes “Wild heating up”. For the next 5 games, I banked $1,698 betting their matches, as they climbed from #17 to #4 in my Power Rankings in just 14 days. And that’s the story of how I got hot betting the Wild. One day I woke up aboard their bandwagon with no knowledge of how I got there.
 
 
6) New York Islanders, ($1,868):
 

My fantastic success betting on the Islanders in Q1 did not extend into the second quarter, but I still finished with a $424 profit. Their win rate declined in Q2 from 60% to 48%, and most of my wagers stayed on Isles moneyline with a much worse rate of return. Although the decrease in win rate came entirely on the road, as they continued winning 2/3 of their home games. Even as their play worsened, I was still betting them to win because they had a really tough schedule against good teams and there were some appealing line offerings. Most of my Q2 bets on Isles to win on the road were small wagers as underdogs.
 
One fun fact about the Islanders in Q2, you would have lost money betting them to win every game on the moneyline, but would have won $536 betting them on every puckline -1.5 goals. Nearly all of their wins were by at least 2 goals, some of those as underdogs +390, +360, +235 twice, etc. So they weren’t just crushing dogs, they were covering against good teams. They were underdogs in 52% of their games, as oddsmakers didn’t drink the Koolaid after their strong first quarter. But also, most of their losses were by 2+ goals. 16 of their 21 Q2 games the winner covered -1.5 goals.
 
Islander overs went 11-9 in Q1, but they shifted back to an under team in Q2 (with unders going 12-9) and it took my algorithm some time to adapt. But once it did, my Q2 NYI O/U performance finished strong. It recommended overs too often, but still managed a profit when doing so. That $46 profit came entirely from Semyon Varlamov starts, who had a lower SV% than Sorokin (.911 vs .923) and his overs went 4-2. And yet, Varlamov had a higher win percentage. Betting $100 on Varlamov to cover -1.5 goals every start generated $756 of profit. Whereas betting Sorokin to lose by 2+ goals every start would have yielded $825. That’s so bizarre it forced me to run a diagnostic on the data. It checked out.
 
 
7) Colorado Avalanche, ($1,698):
 

The Avalanche started the season strong, but without their captain Gabriel Landeskog. Eventually more of his teammates joined him on the injury list, most importantly Nathan MacKinnon, whom they lost for 11 Q2 games. This created a very profitable opportunity to invest in Avalanche opponents, which I did with great success, helping the Avs climb my Power Rankings despite dropping in the standings. Both Nichushkin and Rodrigues returned from injury, only to hurt themselves again a few weeks later. Hard to say if this is a residual effect of their run to the Stanley Cup, or just terrible luck.
 
They were sitting outside a playoff spot as the end of the first half approached, but with Mack back it’s time to exercise more caution when betting them to lose. I’ll need to see them get hot before jumping on the bandwagon though, as they were still missing some key pieces as the first quarter came to a close. One of the key impacts of all the injuries was an alarming reduction in goal scoring, which dropped by more than a goal per game from one quarter to the next. Meanwhile, the goaltending got worse, as I can confirm as an Alexandar Georgiev owner in fantasy hockey.
 
While I was able to generate profit both when betting Colorado to win and lose, the same success did not translate to their over/under. Their unders went 13-6-2, and my algorithm recommended them a majority of the time, but still produced a loss thanks to 3 consecutive overs in blowout losses, which included getting lit up for 6 goals by the Arizona Coyotes. Those blowout losses were followed by 4 consecutive unders when I had the over, losing -$800 in a 6-game stretch. Unders went 8-1, then overs went 3-0, then unders went 4-1. Back and forth and back again is a problem for my method.

 
8) Dallas Stars, ($1,595):
 

The Stars were much the same team in Q1 and Q2, which helped me deliver consistent success in both quarters. One big difference was that they were one of the best teams -1.5 goals in Q1, but did not carry that over to Q2. My splits betting them to win and lose were similar in both quarters, but my over/under results were less impressive in Q2 (though did still produce a profit). Their overs were 9-8-2 in Q1, but their unders were 14-7-1 in Q2. You’d think that one side being that much better would produce improved results for my algorithm, but it crushed both sides when there was nearly an even split in Q1.
 
Where I started to struggle in the second quarter was betting Dallas opponents, which was not due to an influx of pessimism, but rather expensive line prices. Reviewing my game notes, I often expressed an interest in betting Dallas, but was scared away by the line price repeatedly. One of the reasons for my skepticism was an injury to Jake Oettinger, where he was not quite his dominant self after returning. Most of my Stars Q1 enthusiasm was based on their incredible goalie, and of course Jason Robertson. Scott Wedgewood had a light workload, but engineered an expensive defeat of my New Jersey Devils, stopping 35 of 36 shots. That’s just a bad beat.

 
Oettinger was still one of the better goalies in the league, but his SV% dropped from .929 to .917, while Wedgewood posted an impressive .920, but only won 2 of 5 starts. My algorithm was fantastic at recommending the correct over/under wager when Oettinger was in goal (producing a profit on both sides), but terrible when Wedgewood was in goal (losing money on both sides). Looking at all revenue sources, I won $738 in Oettinger starts and lost -$196 in Wedgewood starts (but did produce a small $30 profit when betting Scotty to lose)
 
 
9) New Jersey Devils, ($1,594):
 

The Devils were spectacular in the first quarter, bringing me along for a very profitable ride. But winning 84% of their games was entirely unsustainable. My foot never came off the gas pedal, aside from one game taking the Islanders +165. I continued betting big on Devils to win early in Q2, but the profit margin started slowing in week 8 before completely collapsing in week 10 when they went 0-4 and cost me -$2,000. That plunged me deep into the red for my Q2 Devils balance, but still above zero for the full season. I was still playing with “house money” but the fee for my deal with the Devils came due.
 
Reading my game notes, the first two weeks of Q2 are ostensibly a love letter to the Devils roster, until that week 8 gut punch, then becomes much more pessimistic. Shortly after that, they lost John Marino and Ryan Graves from their back-end, with Marino being one of their key summer acquisitions that helped spark their turn-around. In both quarters the Devils were actually a better team on the road, as they’ve struggled on home ice at various stretches in recent years. They were so good in Q1 it was barely noticeable they were worse at home, but the splits became very exaggerated in Q2, winning 23% at home and 75% on the road.
 
Their unders went 8-8-3 in the first quarter, then 12-8-1 in Q2. My algorithm turned a small profit, but only because of a $347 profit betting unders in 5 Akira Schmid starts. Losing money when either of the 2 other goalies got the start. Vitek Vanecek continued to carry the bulk of the workload, but his SV% dropped from .918 to .910. The Devils scored fewer goals and allowed more. One fun stat: Akira Schmid posted the highest save percentage of any of their goalies (.911) but you would have won more than $700 by betting $100 on him to lose every game by at least 2 goals.
 
 
10) Montreal Canadiens, ($1,553):
 

The $1,500 of profit that I was able to generate on Montreal in Q1 had completely vanished 3 weeks into Q2. The primary culprit was over/under wagers, which my algorithm gracefully exploited in Q1 only to completely collapse in Q2, losing -$1,000 in that calamitous 3-week stretch when they dropped from #2 in my Power Rankings all the way down to #26. They ended Q1 with games of 10, 9, and 9 goals (both for and against), then started Q2 with games of 4, 5, 4, 3 goals, followed by games with 8 and 13 goals, followed by 6, 6, 3, 5 goals. A 10-game stretch were my algorithm went 2-7-1.
 
One of my issues is that if you were just setting lines based on win-loss records, many of the lines were set far higher or lower than winning percentage would imply. Looking at my game notes, most of the formulas that I employ to measure line value were constantly pushing me towards the Canadiens, especially earlier in the quarter. I was almost exclusively betting them as longshot underdogs with moneylines at +235, +200, +280, +190, +170, +230, +265, etc. They really started to suck in the later half of Q2, which was when I became very aggressive betting their opponents.
 
They managed to pull themselves out of the basement region of my ranks in the last few weeks of the quarter, bouncing all the way back up to #10. The biggest story was the complete collapse of their offense, dropping from 3.1 goals scored per game down to 2.3. Jake Allen was ostensibly the same goalie in both quarters, but Sam Montembeault got worse, dropping from a .915 SV% down to .889. Yet I got massacred betting his overs, because he started the first 2 games of the quarter, which was when the bulk of my O/U Montreal losses occurred.
 
 
11) St. Louis Blues, ($1,333):
 

If you followed St. Louis through my quarterly reports last season, they alternated back and forth between good and bad results. Good quarters were followed up by bad quarters, and that’s what happened this Q2. They entered Q2 on a 7-game winning streak (which had been preceded by an 8-game losing streak), only to lose 8 of their first 10 Q2 matches. They suck, they’re good, they suck. You just can’t trust this team one way or the other. They were simultaneously among my worst teams to bet on and against. One of the rules in my new betting book was never trust the St. Louis Blues to win or lose.

 
Shifting back and forth from hot to cold is tough for bettors, and the only thing that saved me from a complete ass-kicking was the remarkable profitability of their overs. Jordan Binnington posted a respectable .912 SV% in the first quarter, but that plunged all the way down to .874 in Q2. He started a majority of their games, despite back-up Thomas Greiss posting far better numbers. Surely he was getting starts against weaker opponents, but still posted a .916 SV% in 6 starts, which was up from .906 in the first quarter.

Not only were the Blues a significantly worse team in Q2, they were better on the road than at home, which is partly to blame for my significant loss when betting them to win or lose. Most of my lost money occurred when the Blues were on the road. What’s strange about that is that I actually bet the Blues more often than not on the road, but from Thanksgiving to Christmas, they were 1-5 when I bet them to win on the road, and 4-1 when I bet their opponents. They were almost always underdogs on the road, and there was a strategy shift on my part to start betting underdogs in Blues games. If anything can happen when they play, just give me the higher payout.
 
 
12) Arizona Coyotes, ($1,303):
 

My relationship with the Arizona Coyotes this season has been nothing close to expectation. I entered the 2nd quarter on a long a streak of consecutive games betting them to win, and stayed on the bandwagon too long. They were losing often early in Q2, but many of the losses were only by 1 goal and/or the Yotes had a lead at one point in the hockey game. I was losing, but not in demoralizing fashion. But I did finally break my streak of 18 consecutive Arizona wagers when they played Boston, the best team in the league, and suffered a devastating loss.

 
I disembarked the bandwagon just in time for David to slay Goliath, costing me -$650. It’s worth noting Boston outshot Arizona 46-16, but Karel Vejmelka personally stole my money. My love for Arizona was dependent on Karel Vejmelka starting in goal (who did decline from a .909 SV% down to .898), as I actively avoided betting on Connor Ingram to win. All that was written in my game notes for the Buffalo game was “not Vejmelka”. Ingram barely played, but was bad when he did (.886 SV%). Though Ingram did defeat the Colorado Avalanche shortly after Christmas, but without Nathan MacKinnon (among others) missing from the line-up.
 
This team was on the road for almost the entire month of November, winning 5 of their first 7 home games after that extended road trip (with me betting them to win 5 of those). After that win against Boston, my money reverted back to the Coyotes, minus one game against Buffalo where I bet the Sabres. If it wasn’t a back-to-back for the Yotes, I probably would have bet them that game too (I love Buffalo but not at -150 on the moneyline). Eventually I won back the money lost on the win vs Boston, but it took a couple weeks.
 
13) Winnipeg Jets, ($1,281):
 

The Jets strong play in Q1 continued in Q2, despite losing some key players to injury (at one point they were without Ehlers, Wheeler, and Schmidt). Most of my money was on Jets moneyline, as betting them to win paid Q1 dividends, so that strategy continued. My Q2 rate of return should have been higher in this category, but they dropped two games against Vegas and Washington at home that cost me -$500. Even with those injuries, I was never comfortable putting big money on a Jets opponent because their goaltending never faltered. Even “Big Save Dave” Rittich had a fantastic quarter in limited action.
 
The Jets were one of the best under bests in the first quarter, but their goal scoring increased considerably in Q2, at least for the first few weeks (that was one area that got worse without Wheeler). The increased offense did come at the expense of some defense, as their goal allowing did increase by 0.3 per game, but these two factors made their overs a better wager, though eventually the offense would cool down and the unders started to pop again. Their overs were on an 8-4 run when Wheeler was injured, and their unders went on a 7-1 run after losing their ex-captain.
 
The Jets were actually a good team to bet -1.5 goals in Q2, profiting $850 if you bet $100 on each (up from just $45 in Q1). They won 15 games and 11 of those were by at least 2 goals. Connor Hellebuyck did decline from a .935 SV% to .923, but was still elite. His unders only went 9-8 because of the goal support, but my O/U algorithm pulled a nice profit from both sides. Whereas Rittich unders went 4-1-1. I was a big winner betting Hellebuyck to win, and a loser when betting Rittich to win (getting caught with a few larger wagers expecting Helley but getting Big Save Dave instead, who went 3-3).
 
 
14) Florida Panthers, ($1,238):


Last quarter my Florida stake was pretty evenly split between Panthers and their opponents, the latter of which produced all of my Q1 profit. Florida only won 47% of their Q1 games, but you wouldn’t know that looking at their Q2 line prices, which remained painfully high. Reason being that they were putting up good advanced metrics, but it just didn’t translate to wins in the standings. Whenever the Panthers were discussed on the PDOcast with Dmitri Filipovic, the discussion was that everything is fine and that “variance” would eventually normalize and the pucks would start going into the opposition net.
 
But the Panthers did not “regress” back to the team they were last season, instead they actually got worse. Fortunately, those PDOcast discussions did not inspire me to bet Florida to win. My foot stayed on the gas pedal and I was not going to switch allegiances until they actually started winning hockey games. I spend far more time focusing on wins and losses than expected goals, which is why 75% of my Q2 Florida money was laid on their opponents, producing a strong return. Though I should have been braver and invested some money in their opponent pucklines -1.5 goals, which was a great bet overall (yielding $1,205 on $100 wagers).
 
Their overs went 11-7-1 in Q1, but that reversed and unders went 12-9-1 in Q2. Their actual goals per game barely changed from one quarter to the next, but a few of their games that did go over went over by a lot. Their betting total was never less than 6.5 the entire quarter. In Q1 Sergei Bobrovsky was bad (.888 SV%) while Spencer Knight was good (.918 SV%), but Bobby got better (.902) while Spenny got worse (.897) in the second quarter, when there was very little difference between the two. I performed much better across all categories when Bobrovsky was in goal, losing money on Knight.


15) Pittsburgh Penguins, ($1,202):
 

Q1 was among my best quarters betting Pens games dating back to October 2019, and the primary driver was their losing record with me betting their opponents. Well they caught fire after Thanksgiving, and caught me with my pants down. In 12 of their first 15 Q2 games, my money was on the road team, with 10 of those games played in Pittsburgh. The home heavy schedule likely added to their early Q2 success, but looking at my game notes, there were several complaints about line prices. Then they lost Kris Letang to a stroke, so I doubled down on Pens opponents, but they didn’t skip a beat.
 
This quarter could have been much worse, had I not made big bets on the visiting Toronto Maple Leafs ML +100 and PL -1.5 goals +255 that the Leafs won 4-1 (along with a big bet on the under). If not for that big jackpot, my losses betting Pittsburgh to lose would have been severe. By the time I came around and started betting Penguins to win, they quickly went from red-hot to ice cold, from a winning streak to a losing streak. This did not lead to a big loss for me, since their line prices commonly scare me off, even when the going the good. I finished the quarter with $183 Penguins profit across all categories.
 
The other thing that caught fire for the Pens in Q2 was their unders, which went 13-6-1 after going 8-10-1 in Q1. The goal scoring dropped considerably, but so did goal allowing as goaltender Tristan Jarry delivered an outstanding .930 SV% in Q2, up from .904 in Q1. Casey DeSmith posted exactly the same SV% (.909) in both quarters. I performed well when betting DeSmith to lose, but took a big loss when selecting Jarry to lose. I did manage to turn a small profit from betting Pens to win, but invested $0 in Pittsburgh to cover +1.5 goals which outperformed their moneyline.
 
 
16) Ottawa Senators, ($1,095):
 

The Ottawa Senators entered this season with high expectations bolstered by the acquisitions of Claude Giroux and Cam Talbot, and they flat out sucked in Q1, winning only 1/3 of their games. That sub-mediocrity would not become the new normal, as they improved considerably in Q2. Cam Talbot eventually returned from injury, Anton Forsberg settled down, and they allowed significantly fewer goals in the second quarter, while goal scoring was down slightly. Improved goaltending means better unders, which went 14-6-2 in Q2, which my algorithm was able to properly exploit.
 
For most of the quarter, my performance was strong both when betting them to win and lose, though should have been betting them to win more often. They climbed up to #2 in my Power Rankings by Christmas, but fell all the way down to #13 seven days later. They had 3 games against teams that were all on hot streaks that I had been betting often, Boston, Washington, and Buffalo. The Sens beat all three with me laying down too much money, losing -$1,207 in one week. I had been doing well when betting Ottawa to win, but they just happened to upset 3 teams that I liked even more, and caught me with my head down.
 
Their goals against dropped by 0.7 goals per game, which was the primary driver of their turn-around. Goals for did decrease too, but by a smaller amount (0.3). Cam Talbot started most of their games, but had an inferior Q2 SV% to his back-up Anton Forsberg (.905 versus .922). I won $519 betting Talbot to win, and lost -$591 when betting him to lose. Despite Talbot’s lower SV% and higher GAA, his unders performed better, going 12-3-1, while Forsberg only went 2-3-1 (which likely means Forsberg received more goal support from his teammates).
 
 
17) Tampa Bay Lightning, ($1,004):
 

The Tampa Bay Lightning’s first quarter was lacklustre by their lofty standards, but they caught fire Q2, as goals scored went up and goals allowed went down. Andrei Vasilevskiy’s underwhelming start became a distant memory as he returned to Vezina form. His resurgence did provide a boost to their unders (offset somewhat by a scoring increase) while my algorithm recommended too many overs. Basically there was an 11-goal game, followed by 3 of the next 4 going under. Abnormally high scoring games followed by low scoring games created a few problems for me with some teams, so my algorithm may require an adjustment.
 
One of the reasons for their hot Q2 start was a home heavy schedule, where they have been a better team in recent years. This also led to some very expensive line prices, which discouraged me from betting Tampa. I performed very well when betting them to win, but should have made a greater commitment to that outcome. Though I did manage a small profit from betting their opponents, which is good considering they only lost 32% of their games. Most of the wagers were small and on underdogs (often longshots) so there were a few scattered jackpots in there. When you’re betting longshots, you can turn a profit with a low win %.
 
Andrei Vasilevskiy posted a remarkable .937 Q2 SV%, and Brian Elliott wasn’t so bad either, posting a .903. Vasy unders went 9-4 while Elliott overs went 3-2-1. I was a net loser on my Lightning over/under because of betting too much on Vasilevskiy overs (explained above) and Elliot unders. There was an advantage to finding out who would be starting before making your picks, but Vasy was much less profitable on the closing line. Because the line moves when he’s confirmed as the starter. If you bet $100 on the opening line for all his unders, you won $418, but only $136 on the closing line.
 

18) Chicago Blackhawks, ($613):
 

Most of my worst teams in the first quarter became my better teams in the second quarter, or at least there was a reversal of dreadfulness, none more than Chicago. It was profoundly disappointing and embarrassing that they finished dead last in my Q1 Power Rankings, as this was a team that should have delivered outstanding profit as they try to tank their way to the first overall draft pick. They won 33% of their Q1 games, dropping down to 19% in Q2. For their first Q2 game I wrote in my notes “Hawks starting to crater” and two games later “they are who we thought they were.”
 
One way that my performance could have been improved was putting all my money on the opponent puckline -1.5 goals instead of going half and half with the moneyline or 2/3 and 1/3. It generally makes me uncomfortable making giant wagers on the puckline alone, preferring to have at least something on the moneyline to minimize the damage if they only lose by a goal. But if you bet $100 on every opponent -1.5 goals, you won $1,272, but only $561 on every moneyline. That’s similar for me, despite laying nearly twice as much on the moneyline, I still won more money from the puckline.
 
Chicago goals scored per game dropped below 2, while goals allowed went up (at least when Petr Mrazek and Arvid Soderblom were in goal). Total goals per game barely changed, but their unders went from 8-10 to 11-9. My algorithm went too heavy on the overs, but that was due to goaltending. Mrazek had a 4.61 goals against average, and his overs went 5-2-1. Meanwhile Soderblom and Stalock had GAAs at 3.68 and 2.18 with unders going a combined 9-4. But my algorithm was remembering terrible Mrazek starts when making recommendations for those games.
 
 
19) Washington Capitals, ($467):
 

Washington ascended to #5 in my Q1 Power Rankings, and a lot of that profit came from betting Caps to lose and over/under. That same recipe for success in Q1 is exactly what killed me early in Q2 when they started winning hockey games. Not only did I bet them to lose for 11-straight games (of which they won 7), but my over/under algorithm went from outstanding to terrible. One of the problems was recommending too many overs, especially in games with high scoring opponents (like Seattle twice) that went under instead. Unders went 7-1-1 to start Q2, then overs went 4-1, then unders went 3-0, then overs went 3-0, then finished with unders going 2-0. They kept flipping back and forth, destroying my algorithm in the process.
 
They might have struggled in the first quarter, but eventually I did take notice that they had transformed from bad to good, and got on the right side of their bets. My games notes from their very first Q2 game was “does Draft Kings know Caps lost 7 of last 9” which also marked the precise moment they started heating up. For the next 3 weeks, my games notes complained that the Caps line was too generous based on their record, until eventually I had to Tweet: “Note to self: stop betting Washington to lose”. They were a great bet -1.5 goals, generating nearly twice as much revenue as moneyline (for me as well).

 
Charlie Lindgren at one point replaced an injured Darcy Kuemper and went on a hot run that was particularly damaging to me personally. Who would have thought Charlie Lindgren would win 4-straight games with a .949 SV% after an injury to Darcy Kuemper? Certainly not me. But Lindgren quickly won me over, and I started making large wagers on Caps to win. It made very little difference to my own performance which goalie was starting, posting similar splits for both. Kuemper had 11 starts with a .937 SV% while Lindgren has 12 starts with a .916.
 
 
20) Boston Bruins, ($298):
 

The Bruins spent virtually the entire second quarter sitting  first place in the NHL standings, but their winning percentage dropped, strange considering they got healthy. They dominated without Marchand and McAvoy, but slipped after everyone was back. If you bet $100 ML on them to win every game in the 2nd quarter, you only walked away with $289. I bet more money on them to win than any other team and walked away with a 12% return and that’s despite 3 games that cost me a combined -$1,500 (losses to Arizona, Los Angeles, and Ottawa). Two of those were Swayman starts.
 
The Bruins won 73% of their home games and 70% of their road games, but their average home moneyline was -208 and betting $100 on each would have only yielded $132 in profit. So it’s great that they were awesome on home ice, but you weren’t going to generate a lot of profit betting all of them. On the road, the average moneyline was -178, which includes -305 when they lost in Arizona. I was +$520 on their home moneyline and -$53 on their road moneyline. They were among the very best teams to bet -1.5 goals in Q1, but the rate of return on their pucklines declined in Q2.
 
For my Bruins betting portfolio, this quarter was a tale of two goalies; winning $1,258 from Ullmark starts, and losing -$991 for Swayman starts. They split the starts 11 to 10, where Ullmark went 9-1 and Swayment went 6-5. Swayman wasn’t exactly terrible, posting a .910 SV%, but it was substantially less than Ullmark’s .943. Ullmark unders went 7-3 while Swayman overs went 6-4. I was a net loser on Swayman unders and Ullmark overs. Perhaps my algorithm should be modified to only count Ullmark games when he is the expected starter? It would have helped me in the second quarter.
 
 
21) Edmonton Oilers, ($152):
 

I really struggled to figure this team out for most of the first half, as the only thing producing a consistently good return was their overs (which went 15-7-1 in Q2), though my algorithm did a subpar job of profiteering from that. Their new prized free agent acquisition Jack Campbell fell flat on his face as the schedule began, but once Stuart Skinner was getting most of the starts, they did find some stability. Looking at their game log, there aren’t any hot streaks or cold streaks, as the wins and losses have an even distribution. But they certainly struggled more towards the end of the quarter.
 
Most of my bets on Edmonton opponents were underdogs, generally small wagers, taking a swing at a juicy line with a good payout, and produced a solid return on those investments. If you bet the Oilers to win every game with equal amounts ML, +1.5, and -1.5, the only positive return was on the puckline +1.5 goals, as you did not want to betting them to win by 2+ goals every game. It is worth noting that the Oilers won 42% of their home games and 55% of their road games, which explains why betting dogs in Oilers games was an effective strategy. They’ve been a solid road team in past seasons too.
 
Stuart Skinner started a large majority of Edmonton games, as Campbell was relegated to a back-up role, but the gap between the two did narrow in Q2, as Stuart Skinner dropped from a .921 SV% down to .909, while Campbell climbed from an abysmal .873 to a slightly less awful .883. Skinner received 70% of the starts, but I was a net loser on those games thanks to my algorithm recommending far too much on his unders (which went 4-11-1). Nearly all of those under recommendations came from low scoring opponents (which are 50% of the weight) but they weren’t low scoring against the Oilers.
 
 
22) Columbus Blue Jackets, ($123):
 

In the previous 5 quarters, the Columbus Blue Jackets were one of the most reliable over wagers, at least until their unders went 15-6 in Q2, which initially produced a big loss for my algorithm, until the trend sustained itself and I started making big investments in their unders. The goal scoring plunged from 3.1 per game all the way down to 2.1, while the goals against also declined by 0.8 per game. Elvis Merzlikins was still terrible (.866 SV%), but Tarasov (.907) and Korpisalo (.924) were much better. Injuries were a problem. At one point they were without Zach Werenski, Boone Jenner, Jakub Voracek, and Patrik Laine.
 
Johnny Gaudreau can’t do everything himself, he needs a supporting cast, which was decimated by injuries. 80% of my money was on Columbus to lose, but only generated a 4.8% return. Their winning percentage dropped from 39% down to 22%, so as bad as they were, my profit from betting that outcome could have been better. The only reason I wasn’t betting their opponents more often is because oddsmakers were fully cognizant of how much they sucked, and charged expensive prices on their losses. There were a few games were I took a swing on BJs as longshots, but the gamble didn’t pay off.
 
Another complication was a stretch were unders went 13-2, but the two overs were 13 and 11 goal games (vs Buffalo and LA), which would cost me -$300 on incorrect over wagers in subsequent matches. This is another example where minimizing weight on outlier games would have led to increased performance. Korpisalo unders went 8-2, and he was the bane of my BJ quarter, with a -$632 loss betting him to lose. He delivered the upsets that cost me the most money. Meanwhile, I generated $838 profit from betting Merzlikins and Tarasov to lose. Korpisalo unders had a higher payout on the closing line, so the public wasn’t buying his resurgence either.
 
 
23) Calgary Flames, ($35):
 

The Flames did not fulfil expectations in the first quarter, and they became considerably worse in Q2, thanks in part to unreliable goaltending. At one point Jacob Markstrom became the back-up, vaulting Dan Vladar into #1 starter duties for 2 weeks (finishing the quarter with a .915 SV%). Throughout the whole episode, this team continued to get priced like a Stanley Cup contender, as my game notes continuously expressed confusion about line price, leading me to bet their opponent, which proved lucrative. One interesting stat, Flames were involved in many 1-goal games, and you could have won nearly $600 betting $100 on both teams +1.5 goals throughout Q2.
 
If you bet $100 on the Flames to win all their games by at least 1.5 goals, you lost -$800. If you bet Calgary opponents to cover -1.5 goals every game, you lost -$900 (that’s reflected in my own betting results, not hitting a single puckline). Calgary was twice as good at home, winning 60% versus 31% on the road. I was having a great quarter betting Calgary to lose during the Vladar era, but wound up losing some of that profit when they won 4 of 6 games in weeks 11 & 12, writing in my betting report that it was time to start exercising caution when picking Flames to lose. Calgary played 2 games on short rest in those 2 weeks that cost me -$750, as they beat Seattle and Anaheim.
 
You would think that the Markstrom struggles would have helped their overs, but that’s not how it played out. That Markstrom cold streak was not permanent, and he eventually improved his play (finishing Q2 with a .901 SV%). Their unders went 13-10, but my algorithm recommended a large stake in overs, leading to a net loss. Once Jake took back the net, their overs hit 5 consecutive games, which was then followed by 5 consecutive unders which cost me -$700. Markstrom unders went 9-5, and he was in net for most of that lost -$700, which led me to take a net loss on all Flames bets for the quarter.
 

24) Vancouver Canucks, (-$87):
 

The Canucks are yet another of my strong first quarter teams where nearly all the profit I had accumulated disappeared in the first 3 weeks of Q2. Much like Washington, it was shifting from bad to good that killed me with Vancouver. I had a great Q1 betting them to lose, and they lost 68% of their games, only to win 55% in Q2. It could have been worse, as my game notes from their fourth Q2 game said “Canucks look to be pulling out of funk” and from there my foot started easing off the gas pedal. Eventually I started betting them to win more often, helping me recover some of my losses from the beginning of their hot streak.
 
The Canucks did improve, but were really bad at covering the spread -1.5 goals, which means you would have had a strong quarter betting their opponents +1.5 goals. I did not place a single wager on Canucks puckline, whether +1.5 or -1.5. Most of their wins were only 1-goal games, and 8 of their 9 losses were by at least 2 goals. So you could have run a nice profit from consistently betting their opponents +1.5 or -1.5 goals. Sadly I bet very little on either, sticking mostly instead to the opponent moneyline, which was a big loser for me, and overall if you bet $100 on each.
 
Their overs went 10-10, but my algorithm recommended too many of them, typically by putting too much weight on some individual high scoring games in their log. They played most of the second quarter without #1 goalie Thatcher Demko, who was already losing starts to Spencer Martin before the injury. Martin was shaky as his replacement (posting an .873 Q2 SV% in 14 starts), but the team was often able to outscore any deficit in goal. Collin Delia began to get the call more often towards the end of the quarter, and went 3-1 with a .902 SV%. All 3 goalies had an even split between overs and unders.
 
 
25) Carolina Hurricanes, (-$104):
 

The Carolina Hurricanes kicked off the second quarter in a slump that peaked with a 4-0 loss to the Arizona Coyotes on the first day of Q2. They lost their next game to Boston, which brought them to 8 losses in their last 10 GP. By then I could smell blood in the water, triggering a feeding frenzy where I bet Carolina opponents for the next 10 games. Canes won 9 of them, and they went on to win 15 of their next 16. This had the potential to be a huge disaster, but the good news was that nearly all of my bets on Carolina opponents were for my minimum amount (and actually produced a small $169 profit across the entire quarter).
 
It took me too long to properly absorb their new hot streak, as I should have boarded the bandwagon sooner, but that loss to Arizona really threw me off the scent. One of the reasons was that my over/under algorithm was crushing their unders, which went 8-3-1 in their first 12 Q2 games. That’s also why I didn’t notice that I had bet them to lose 10 consecutive times losing 9; because they never showed up on my radar for teams costing me money. One of their few losses in that run was to Anaheim, whom I had bet on the moneyline at +225. My worst week of the quarter I lost -$250 in week 8.

 
Carolina’s “#1” goalie Freddy Anderson was injured for the entire quarter, which initially only encouraged my short position. Their hot streak was on the back of Pyotr Kochetkov, who won 8 of 12 starts with a .920 SV%. My algorithm went 10-1-1 on Kochetkov starts, producing $1,200 of profit (but losing -$733 from Antti Raanta starts). That’s how I came out ahead betting Pyotr starts despite a devastating week 13 when the Canes went from red hot to ice cold. Across all categories, I profited $819 from Kochetkov starts, and lost -$1,045 from Antti Raanta starts. Kochetkov unders went 8-3-1, while Raanta overs went 6-3.
 
 
26) Seattle Kraken, (-$260):
 

My Kraken season started poorly as they exceeded my expectations, but once my eyes were open, Q1 finished strong. Seattle’s winning percentage was even higher in Q2 (from 57% to 62%), but my output when betting them did diminish. Part of the problem was that their lines became more expensive because oddsmakers also had their eyes opened, diminishing the return. Looking at my game notes, there was a lot of complaining about line prices, though I was reluctantly betting them often because my “line value” algorithm still thought it was worth the cost. Thankfully I listened.
 
Picking their wins and losses was not the reason for my bad Q2 Kraken performance, performing well betting them to win. But their over/unders were a dumpster fire. Their overs went 10-10-1 and 81% of my stake was devoted to that outcome, resulting in a substantial loss on both sides. The problem started with their 17-goal game vs Los Angeles that was followed by 4 consecutive unders that cost me -$700. Their unders had a strong first quarter, but their goaltending got worse, as their goals allowed per game increased from 2.7 to 3.5. They still won games because their goals scored also went up from 3.2 to 4.
 
One of the issues was Martin Jones turning back into pumpkin (dropping from a .912 SV% to .875, though mostly confined to a few terrible starts). You look at their game log, and they had 6 games where 9 or more goals were scored, and in between they had 11 games with 6 goals or less. There were plenty of blowouts, with a lot of unders in between. It was the perfect storm to mess with my algorithm. Also, Jones overs went 8-4, while Grubauer unders went 6-2-1 despite his .889 Q2 SV%. What’s interesting is that Jones overs and Grubauer unders had higher payouts on the closing line, so the public was betting the wrong side too, not just me.
 
 
27) Los Angeles Kings, (-$363):
 

The only reason I was able to produce a Kings Q1 profit was outstanding success on their over/under, especially overs. Unfortunately, their unders started hitting more often, but they were also involved in scattered high scoring games thanks to unreliable goaltending. Pheonix Copley came out of nowhere in the middle of Q2 and wrestled the primary starting duties away from Jonathan Quick. The 30-year-old journeyman Copley won 11 of his first 13 starts. It wasn’t outstanding goalkeeping, but the Kings were able to find success with competent goaltending. That’s all they needed to get hot.
 
The Kings started Q2 poorly, but lit a fire with Copley. They were also a very good road team, winning 60% versus 50% at home (after a 40-60 split in Q1), which added a layer of difficulty betting their wins and losses. It actually would have been a good quarter for me both betting Kings to win and lose had it not been for 2 games. An upset win against the Bruins in Boston, and a home loss to the Flyers who had just lost Carter Hart to injury. Those two games cost me -$1,100. This summary would have a much more optimistic tone if not for those bad beats.
 
One thing that hurt LA overs was Cal Petersen getting sent to the minors. I’m a predator who hunts for bad goalies, so whenever one leaves the league, it pains me deeply. I won $408 from Quick’s over/under, but lost -$825 on Copley. There was an 11-goal game featuring Quick, that was followed by 3 Copley unders that cost me -$500. Quick’s SV% dropped from .892 down to .871 from Q1 to Q2, while Copley posted a respectable .904. Though he only has 40 career starts, so there are no guarantees that he won’t turn back into a pumpkin, but enjoy the party while it lasts.
 
 
28) Detroit Red Wings, (-$608):
 

My dismal results betting Red Wing games in the first quarter could be entirely blamed on Alex Nedeljkovic, both when betting him to win and lose. It was great news for me when he was demoted to the minors, so it’s no coincidence that coincided with a reversal in my Wings betting profitability, though not in the way logic would imply. The reason for my newly unleashed success was a high rate of return when betting Ville Husso to lose, as his SV% dropped from .916 in Q1 all the way down to .891, while the offense generated 0.5 goals per game less. Hence how betting Detroit to lose became a good wager.
 
The Wings went from sitting in a playoff spot at American Thanksgiving (when the playoff race is decided), to winning just 35% of their Q2 games. Despite being a fan of the team, I was pretty quick to jump on the other side when they began showing signs of weakness. I actually pulled a nice return both when betting them to win and lose, as they still managed a few impressive victories against long odds. All those wagers were for my minimum amount, generally with high payouts. I also banked $1,260 betting the Red Wings to lose on the second half of back-to-backs vs rested opponents.
 
They could have been among my top teams of the entire quarter, had it not been for my algorithm shitting the bed like Kendall Roy on their over unders. Their unders went 12-7-1, but my algo recommended a large majority stake in their overs, while also losing money on their unders. At one point they hit 7 consecutive unders of 6 goals or less, which was followed by 5 games with 9, 7, 11, 9, 9 goals. Guess what, that was followed by 6, 6, 5, 5 to end the second quarter. I lost -$1,213 on their over/under for their final 9 games of Q2, with similar rates of return for Husso and his new back-up Magnus Hellberg.
 
 
29) Philadelphia Flyers, (-$887):
 

Betting the Flyers to lose was a good wager in Q1, at least after the first few weeks. What made them dangerous early in Q1 (and sporadically afterwards) was super-human play by Carter Hart, who could not continue stealing that many games (SV% dropped from .920 in Q1 down to .894). They were among the worst NHL teams early in the second quarter, losing 10 of their first 13 Q2 games with Hart starting almost every night. Then they lost Hart to injury and won 5 of their next 6 games. Sadly I saw that injury as an opportunity and slammed my foot on the gas pedal, losing over -$1,400 in 2 weeks (I’m already turning a profit betting them to win thus far in Q3).
 
Rookie Samuel Ersson won 4 of his first 5 starts, costing me dearly. Sammy cost me more dough than any other goalie in the second quarter. Perhaps it was my own fault for betting San Jose, LA, and Anaheim to beat them, not exactly juggernauts. Travis Konecny also caught fire, providing a big spark to the Philly offense. Their unders started Q2 by going 9-3, thanks to strong play by Carter Hart and struggling scoring from their offense. That would eventually come to an end, as their overs went on a 7-2-1 run to close the quarter, which was aided by a sudden increase in goal scoring driven largely by Travis Konecny.
 
The Flyers proved effective at covering +1.5 goals, despite losing many games. That’s reflected in my own betting results, but not in a positive way, taking a big loss betting Philly opponents -1.5 goals. Those last 2 weeks when I was bleeding money, the Flyers covered -1.5 goals in 4 of their last 5 games (at +450, +220, +165, and +400) to finish with a nice Q2 profit in that category. You would have lost -$24 betting $100 on every Philly moneyline, but you could have won $484 taking every puckline +1.5 goals, and $680 covering -1.5 goals.
 
 
30) Vegas Golden Knights, (-$950):
 

The Golden Knights dominance on the road continued in the second quarter while experiencing a significant decline in home winning percentage (they went 6-3 on the road and 6-7 at home). That does beg the question; did Covid kill the “Vegas flu” or did their own players just become more vulnerable to the disease? There have been news stories that pandemic measures reducing viral exposure might have made people more susceptible to bad flu cases. Could that have happened with the Vegas flu? Somebody ask Bruce Cassidy, who has theories about their poor home record this year.

 
My performance betting Vegas games did improve, but still was not impressive. They were not nearly as good a team in Q2, and injuries likely played a major role, losing Shea Theodore, Jack Eichel, and Alex Pietrangelo for extended periods. Eichel returned on Jan 5, scoring 3 PTS in a win vs Pittsburgh. My expectation was that they would be back to their first half form once they got some of those big pieces back from IR, until news broke they lost Mark Stone week-to-week early in Q3. Despite the injuries and decreased performance, the extra money I laid on Vegas opponents still led to a net loss.
 
There was an even split between their overs and unders in Q1, but the unders went 12-8-2 in Q2. My algorithm did recommend a large majority of my stake to be laid on unders, yet only made $13 when doing so. Goaltender Logan Thompson fell out of the Vezina race, as his SV% dropped from .920 to .908. Adin Hill also declined from .909 to .895 but still had a winning record. It actually did not matter which goalie was starting for over/under, as both had the exact same ratio of overs to unders and nearly identical rates of return on each wager. I posted a small loss on both goalies across all categories.
 
 
31) New York Rangers, (-$1,139):
 

The Rangers ranked 31st in my 1st quarter Power Rankings, and all my losses came from over/under and betting Rags to win. When Q2 began, I had two good weeks betting Rangers to lose (when they lost 5 of 7), but had to slam on the brakes when they followed that up by winning 7 of 7. When they abruptly shifted from cold to hot, my losses piled up quickly before the brakes were activated. Once their play improved, the line prices grew much more expensive, and there were still a significant number of games where I didn’t want to pay the tax, despite already being on their bandwagon.
 
They can attract a lot of public money when the going is good, as it’s easy to like a team with one of the league’s best goaltenders. Igor Shesterkin was ostensibly the same goalie in both quarters, as the improved winning percentage was driven by the improved goal scoring (which is why their unders went 13-7 in Q1 and 10-11 in Q2). My algorithm recommended a 50-50 split between overs and unders, making a decent return on their overs. One thing that shocked me when compiling the goalie chapter of this report, is that Jaroslav Halak was one of my best goalies to bet league-wide, while Shesterkin was one of my worst.
 
Halak improved substantially from one quarter to the next, jumping from .883 up to .907. What surprised me was winning $1,348 betting Halak to win/cover (he only started 6 games), most of that coming from wins over Montreal and Philly (before the Flyers got hot). A chunk of those winnings were -1.5 goals, but that’s a bet that I did make often enough with this team. They were among the best teams in the league -1.5 goals in Q2, and you could have generated a higher return from the puckline than moneyline. Halak had a higher rate of return -1.5 goals than Shesterkin, but also received easier assignments as the back-up.
 
 
32) Nashville Predators, (-$1,994):
 

To say it’s been an up and down season for the Predators is not correct, more like down, then up, then down again. A bad start followed by a hot streak followed by a cold streak, followed by another hot streak. The Predators showed signs of life at the beginning of Q2, with big wins in week 8 against the Devils and Islanders, two teams I rode hard in the first quarter. After those 2 wins they were 7-2 in their previous 9 games, so I started talking myself into Nashville being a good wager. So that’s what I did, only to get the rug pulled out from underneath me.
 
It seemed like I was always on the other side of whatever streak they had, but for all their struggles, they were actually a very good team when my money was on their opponent. They also made me feel stupid most times I bet them to win. I’m almost tempted to just bet them to lose every game in the second half so Juuse Saros can get hot and help both my fantasy teams. Speaking of my man Juuse, he was sensational in the second quarter, as his SV% jumped from .905 to .934. Kevin Lankinen once again provided solid back-up goaltending, and once again I took a sizeable loss betting him to lose.
 
Nashville unders went 9-8 in Q1 and 11-8-1 in Q2 by giving up 0.6 fewer goals per game. When it came to over/under, it did not really matter which goalie got the start, as both has very similar splits and rates of return on each. My algorithm’s biggest mistake was putting too much money on Lankinen overs, though did not make recommendations based on which goalie started. Saros unders went 8-6-1, at least on the opening line, as he had a substantially lower payout on the closing line. Seems like the public likes getting news that Saros is going to play, then hammering the under.

No comments:

Post a Comment